Trading
Trader Journal & Performance Dashboard (Excel + Google Sheets)
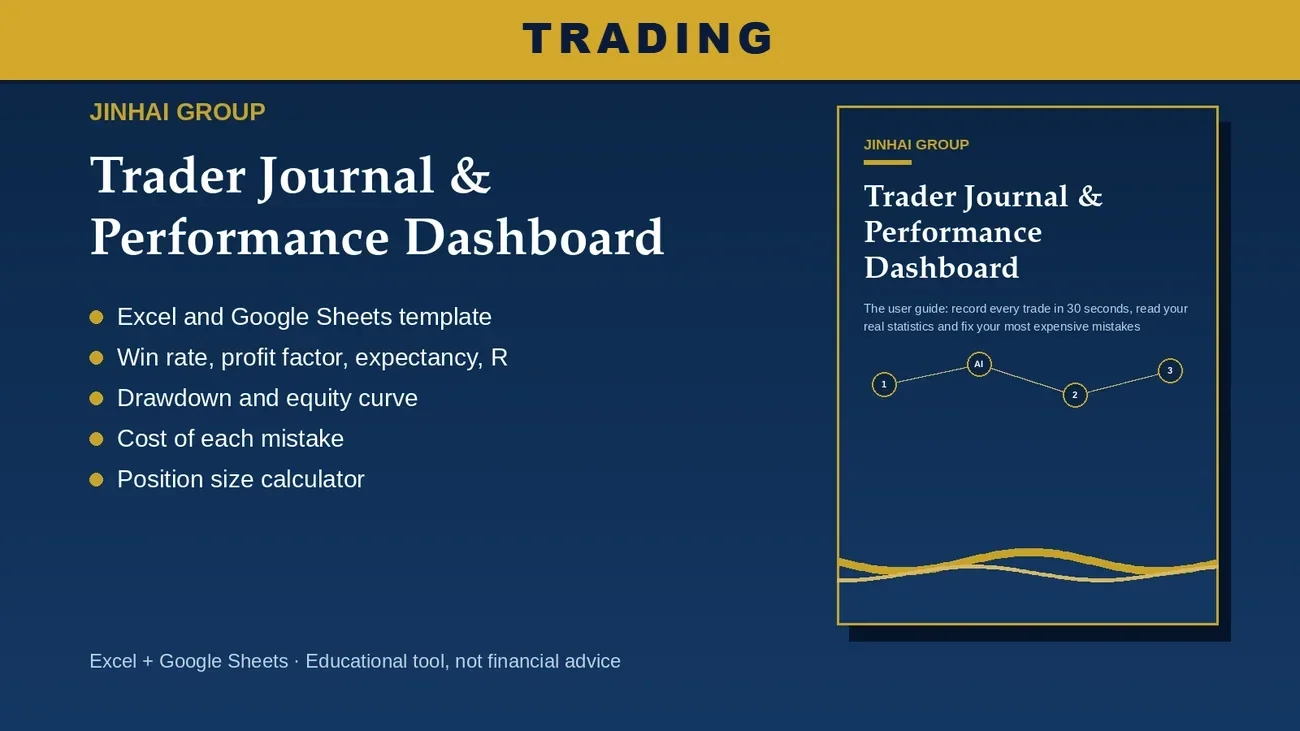
Know your real numbers. Record each trade in about 30 seconds and let the dashboard calculate your statistics automatically.
What the dashboard shows
- Win rate, average win and loss, profit factor, expectancy
- R multiple for every trade and average R
- Max drawdown and equity curve
- Results by instrument, setup, weekday and month
- The cost of each mistake (moved stop, FOMO, revenge trade...)
- Plan adherence and the result of trades where you broke your plan
Also included
- Position size calculator (lots from your risk % and stop distance)
- Drop-down lists you can customise (instruments, setups, mistakes, emotions)
- A 12-page PDF guide: setup in 5 minutes, what each number means, weekly review and a 30-day challenge
Format: ZIP with an .xlsx file (500 trade rows) and a PDF guide. Works in Excel, Google Sheets and LibreOffice.
Educational content only, not financial advice. Trading leveraged products carries a high risk of losing money. This tool records and measures your own trades; it does not predict results.
$13.00
Available
Instant Delivery
Secure Payment
24/7 Support
Replacement
Secure payment powered by Stripe